There are a lot of views being thrown around in the blogosphere during the last week or two regarding the new sales data released for June ’09. It seems that there is a lot of “spin” going on depending on which outlet you read. I try to be positive and in general I think that if everyone thought more positively then we would already have our recovery instead of sitting around waiting for it. Having said that I think when statistics are used they should be clear and unfiltered. So I wanted to lay out some facts garnered from lots of different sources, but primarily the NYT, Bloomberg, and WSJ:
· The June gain of 11% was based on an extrapolated annual estimate using seasonally adjusted monthly rate and still represents a significant drop from a year ago.
· The unadjusted numbers still show the slowest June sales since 1982.
· The gain in number of homes sold also comes at the expense of lower prices per home.
· The report in June was stronger than anticipated by most economists and a bit of a good surprise.
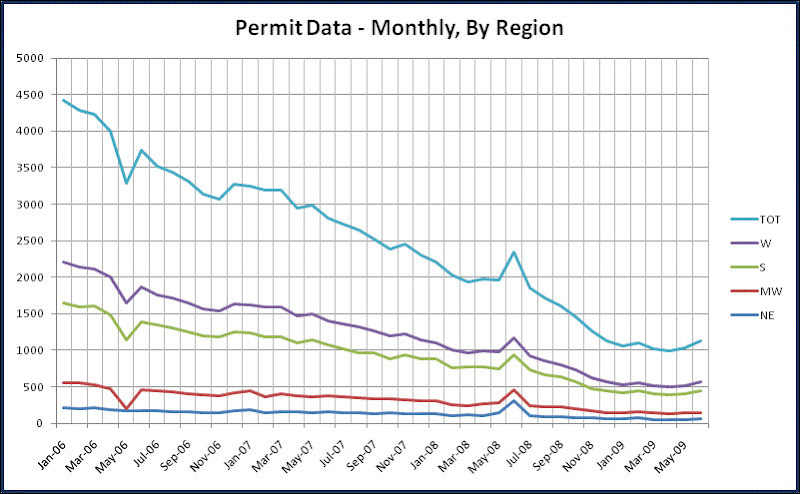
· The single family housing starts have been on a four month rising trend.
· Low interest rates and government incentives are spurring home sales, assisted by lower prices on existing homes.
· Sales appear to be strongest in the Midwest and West and leveling off in the South and Northeast regions.
· The length of time that a new home sits before being sold is at an all time high of 11.8 months.
· Homes sales numbers will continue to be sluggish until the unemployment numbers start recovering, which is generally looked for in 2010.
· The inventory of homes is currently low but the sale rate does not yet support a large jump in building. (Low inventory, but also low demand)
· The NAHB housing index bottomed out in January and has risen since. The index is still below 50%, indicating pessimistic outlooks by builders.
Post a Comment